Posts
Analysis Report : Crude Oil
- Get link
- X
- Other Apps

Analysis Report : Crude Oil Overview : Crude oil is a raw material for the petroleum products. It is the third highest traded script in the world. Majorly crude is produced in gulf countries. India is the one of the highest importer of crude oil. So, due to any variation in crude prices Indian stock market gets impacted. Technical View : From last 3 days prices of crude oil is going up along with the rise in volume. On daily chart, crude made a bottom at near 3000 and take a reversal. Since then it is making higher highs and higher lows and moves in uptrend. Recently it gives breakout. On CRUDE MCX chart 4,350 is looking as a strong resistance. Since from 10/6/2016 crude continuously traded below this level. This level act as a long term hurdle for the script. On weekly chart if it closes above this level successfully then 5000 will be on card. Above 4330 crude can touch 4830 / 5000 in upcoming days . Good for - Reliance Industry, ONGC and other oil drilling a...
Analysis Report #SUNPHARMA
- Get link
- X
- Other Apps

Stock Analysis : Sun Pharmaceutical Industries Ltd. Overview : Sun Pharmaceutical Industries Limited ( NSE: SUNPHARMA, BSE: 524715 ) is an Indian multinational pharmaceutical company headquartered in Mumbai, Maharashtra that manufactures and sells pharmaceutical formulations and active pharmaceutical ingredients (APIs) primarily in India and the United States. The company offers formulations in various therapeutic areas, such as cardiology, psychiatry, neurology, gastroenterology and diabetology. It also provides APIs such as warfarin, carbamazepine, etodolac, and clorazepate, as well as anticancers, steroids, peptides, sex hormones, and controlled substances. Technical View : Sun Pharma is cracking 7-8% from 563 to 515 ahead of the US FDA inspection scheduled in next few days. No One knows what’s the outcome. However Technically, the overall structure of the charts is weak. Stock has broken an important support 540 joining the rising trend-line support from l...
Dan Zanger’s 10 Golden Rules
- Get link
- X
- Other Apps
1. Make sure the stock has a well formed base or pattern. 2.Buy the stock as it moves over the trend line of that base or pattern and make sure that volume is above recent trend shortly after this "breakout" occurs. Never pay up by more than 5% above the trend line. You should also get to know your stock's thirty day moving average volume. 3.Be very quick to sell your stock should it return back under the trend line or breakout point. Usually stops should be set about $1 below the breakout point. The more expensive the stock, the more leeway you can give it, but never have more than a $2 stop loss. Some people employ a 5% stop loss rule. This may mean selling a stock that just tried to breakout and fails in 20 minutes or 3 hours from the time it just broke out above your purchase price. 4.Sell 20 to 30% of your position as the stock moves up 15 to 20% from its breakout point. 5.Hold your strongest stocks the longest and sell stocks that stop moving up or are acting sl...
Analysis Report #CNX Nifty 50
- Get link
- X
- Other Apps

www.jskfin.com NIFTY Analysis Overview : The NIFTY 50 index is National Stock Exchange of India's benchmark broad based stock market index for the Indian equity market. It represents the weighted average of 50 Indian large cap company stocks. Nifty is owned and managed by India Index Services and Products (IISL) , which is a wholly owned subsidiary of the NSE Strategic Investment Corporation Limited. IISL had a marketing and licensing agreement with Standard & Poor's for co-branding equity indices until 2013. The Nifty 50 was launched on 21st April 1996. NIFTY 50 is the world’s most actively traded contract. Today, Dalal Street seen the bloodbath after the huge rally from last couple of days. Nifty 50 declined 256.30 points, or 2.33% and closes at 10,760.60 . On the last day of the week and ahead of budget investor get disappointed and sells the equity worth over 5 lakh crore. The main cause of this disappointment is the LTCG (Long Term Ca...
Stock Pick #DIXON : Dixon Technologies
- Get link
- X
- Other Apps

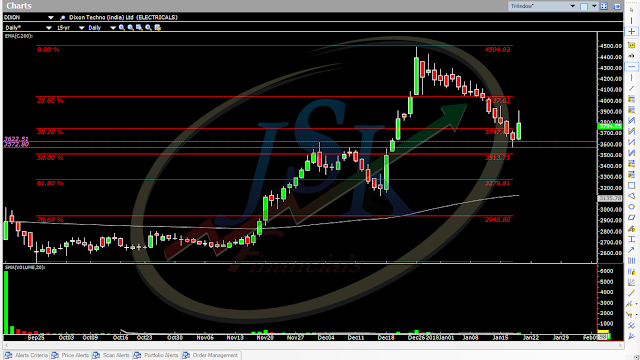
Stock Analysis : Dixon Technologies Overview : Dixon Technologies (India) Limited is the largest home grown design-focused and solutions company engaged in manufacturing products in the consumer durables, lighting and mobile phones markets in India. Dixon is leading manufacturer of lighting products of CFL, LED bulbs, LED TVs and semi-automatic washing machines in India. Dixon manufacture products for popular retail brands including Panasonic, Philips, Haier, Gionee, Surya Roshni, Reliance Retail, Intex Technologies, Mitashi and Dish . They also provides solutions in reverse logistics i.e. repair and refurbishment services of set top boxes, mobile phones and LED TV panels. Dixon is also a leading Original Design Manufacturer (ODM) in India. Company develop and design products in-house at its R&D facility. The ODM business contribute over 25% of its revenue . Company have six manufacturing facilities located in the states of Uttar Pradesh and Uttarakhand. Technica...
Stock Pick #CLNINDIA : Clariant Chemicals (India) Ltd.
- Get link
- X
- Other Apps

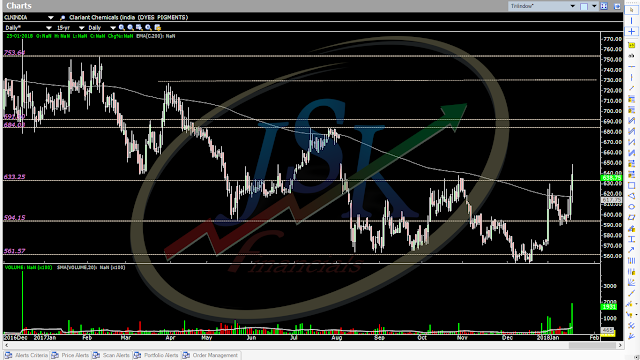
Stock Analysis : Clariant Chemicals (India) Ltd. Overview : Clariant Chemicals India Ltd is an Switzerland based specialty chemicals manufacturing company. The India office is headquartered in Thane. It also largest producer of Pigments, Textile Chemicals & Leather Chemicals in India. The main business activity of Clariant Chemicals (India) involves manufacture of specialty chemicals for domestic and industrial use. It manufactures and markets textiles, leather, paints, plastic, printing inks, and agrochemicals products in India. It has presence in many international markets. Technical View : Forming Double Bottom pattern on Daily Basis and today taking a healthy breakout with huge volume. If it sustain above 638 and 3 days + weekly close above this level, then we will see this stock blasting upto 690. Buying zone is seen at 630 - 640 in upcoming days stock is heading towards 688/730/755 .
Chart Analysis #JustDial Ltd.
- Get link
- X
- Other Apps

Stock Analysis :JustDial Ltd. Forming Double Bottom pattern on Weekly Basis and taking a healthy breakout with volume. Most important factor is that it took 18 months to form, such pattern's success ratio is higher and it will give high return in short term. If it sustain above 640 and 3 days + weekly close above this level, then we will see this stock blasting upto 910. Buying zone is seen at 620 - 640 , in upcoming days stock is heading towards 745 / 910 .
